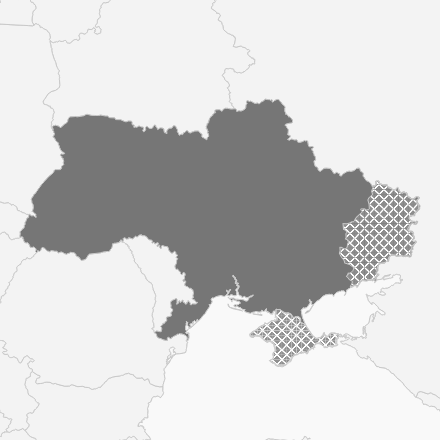
The EPI recognizes the Autonomous Republic of Crimea, the city of Sevastopol, parts of Donetsk, Kherson, Luhansk, and Zaporizhzhia regions as Ukraine’s territory but unscorable at present due to their temporary occupation by the Russian Federation.
Ukraine
RegionFormer Soviet States
GDP516.68[PPP 2011$ billions]
GDP per capita11706.97[$]
Population44.13[millions]
Land Area601639.42[sq. km]
Country Scorecard
| Component | Rank | EPI Score | 10-Year Change |
|---|---|---|---|
| EPI | 52 | 49.60 | 6.20 |
| Ecosystem Vitality | 73 | 48.00 | 4.30 |
| Biodiversity | 76 | 61.70 | 2.90 |
| Terrestrial biomes (natl) | 101 | 75.30 | NA |
| Terrestrial biomes (global) | 102 | 76.00 | NA |
| Marine protected areas | 37 | 69.30 | NA |
| Protected Areas Rep. Ind. | 135 | 15.70 | 2.40 |
| Biodiversity Habitat Index | 172 | 30.10 | NA |
| Species Protection Index | 59 | 67.30 | 31.00 |
| Species Habitat Index | 90 | 84.20 | -2.70 |
| Ecosystem Services | 103 | 23.30 | -6.40 |
| Tree cover loss | 109 | 11.10 | -4.30 |
| Grassland loss | 45 | 63.80 | -36.20 |
| Wetland loss | 67 | 55.70 | 10.30 |
| Fisheries | 47 | 23.70 | 8.40 |
| Fish Stock Status | 61 | 27.40 | 19.70 |
| Marine Trophic Index | 18 | 29.60 | NA |
| Fish caught by trawling | 42 | 11.40 | 4.60 |
| Acidification | 40 | 94.60 | 24.70 |
| SO2 growth rate | 1 | 100.00 | 31.80 |
| NOx growth rate | 46 | 89.30 | 17.60 |
| Agriculture | 53 | 44.70 | 9.10 |
| Pesticide | 141 | 10.00 | NA |
| N Mgmt Index | 1 | 79.50 | 18.30 |
| Water Resources | 68 | 14.10 | NA |
| Wastewater treatment | 68 | 14.10 | NA |
| Health | 74 | 43.60 | 4.00 |
| Air Quality | 88 | 35.90 | 6.60 |
| PM2.5 | 125 | 21.70 | 8.50 |
| Household solid fuels | 71 | 50.80 | 5.10 |
| Ozone | 59 | 53.80 | 10.60 |
| NOx | 114 | 21.00 | -0.80 |
| SO2 | 128 | 34.60 | 7.80 |
| CO | 63 | 59.90 | 4.30 |
| VOC | 34 | 63.40 | 0.90 |
| Sanitation Drinking Water | 66 | 55.20 | -0.50 |
| Sanitation | 79 | 55.20 | -0.20 |
| Drinking water | 58 | 55.10 | -0.80 |
| Heavy Metals | 42 | 68.40 | 4.60 |
| Lead | 42 | 68.40 | 4.60 |
| Waste Management | 88 | 32.00 | -0.20 |
| Solid waste | 72 | 51.50 | NA |
| Recycling | 174 | 4.50 | 0.30 |
| Ocean Plastics | 104 | 20.40 | -1.10 |
| Climate Policy | 31 | 54.70 | 9.60 |
| Climate Change | 31 | 54.70 | 9.60 |
| CO2 growth rate | 14 | 67.10 | 16.00 |
| CH4 growth rate | 31 | 59.00 | -11.40 |
| F-gas growth rate | 112 | 37.80 | -16.00 |
| N2O growth rate | 88 | 63.80 | -5.60 |
| Black Carbon growth rate | 63 | 86.80 | -13.20 |
| Proj. GHG Emissions | 82 | 39.10 | 16.90 |
| CO2 from land cover | 81 | 46.70 | 5.10 |
| GHG intensity trend | 14 | 81.30 | -18.70 |
| GHG per capita | 107 | 42.20 | 8.90 |
Peer Comparisons
EPI Scores for this country and peers based on similar characteristics
| Environmental Protection Index | |
|---|---|
| Poland | 50.6 |
| Panama | 50.5 |
| Portugal | 50.4 |
| Belize | 50 |
| Canada | 50 |
| Gabon | 49.7 |
| Ukraine | 49.6 |
| Saint Lucia | 49.4 |
| Kiribati | 49 |
| Belarus | 48.5 |
| GDP per capita | |
|---|---|
| Saint Vincent and the Grenadines | 53.2 |
| Ukraine | 49.6 |
| Saint Lucia | 49.4 |
| Moldova | 42.7 |
| Peru | 39.8 |
| South Africa | 37.2 |
| Egypt | 35.5 |
| Lebanon | 32.2 |
| Mongolia | 29.6 |
| Indonesia | 28.2 |
| Issue Performance | |
|---|---|
| Hungary | 55.1 |
| North Macedonia | 54.3 |
| Panama | 50.5 |
| Ukraine | 49.6 |
| Albania | 47.1 |
| Montenegro | 46.9 |
| Ecuador | 46.5 |
| Mexico | 45.5 |
| Serbia | 43.9 |
| Thailand | 38.1 |
| Government Effectiveness | |
|---|---|
| Ukraine | 49.6 |
| Ecuador | 46.5 |
| Brazil | 43.6 |
| Moldova | 42.7 |
| Dominican Republic | 42.2 |
| El Salvador | 40.8 |
| Guyana | 38.5 |
| Kenya | 30.8 |
| Cambodia | 30.1 |
| Mongolia | 29.6 |
| Regulatory Quality | |
|---|---|
| Ukraine | 49.6 |
| Tonga | 43.8 |
| Bhutan | 42.5 |
| Tunisia | 40.7 |
| Bosnia and Herzegovina | 39.4 |
| Azerbaijan | 38.6 |
| Kyrgyzstan | 35.7 |
| Senegal | 33.9 |
| Cote d'Ivoire | 32.8 |
| Benin | 29.6 |
| Voice and Accountability | |
|---|---|
| North Macedonia | 54.3 |
| Ukraine | 49.6 |
| Armenia | 48.3 |
| Albania | 47.1 |
| Montenegro | 46.9 |
| Paraguay | 40.9 |
| El Salvador | 40.8 |
| Georgia | 39.1 |
| Fiji | 31.3 |
| Indonesia | 28.2 |
| Rule of Law | |
|---|---|
| Sao Tome and Principe | 52.9 |
| Gabon | 49.7 |
| Ukraine | 49.6 |
| Mexico | 45.5 |
| Azerbaijan | 38.6 |
| Zambia | 38.4 |
| Togo | 34 |
| Benin | 29.6 |
| Papua New Guinea | 24.8 |
| Pakistan | 24.6 |
| Control of Corruption | |
|---|---|
| Ukraine | 49.6 |
| Djibouti | 47.5 |
| Mexico | 45.5 |
| Bolivia | 40.1 |
| Egypt | 35.5 |
| Togo | 34 |
| Mozambique | 31.7 |
| Mali | 28.5 |
| Mauritania | 28.1 |
| Pakistan | 24.6 |
| Political Stability / Absence of Violence | |
|---|---|
| Ukraine | 49.6 |
| Zimbabwe | 46.2 |
| Egypt | 35.5 |
| Cote d'Ivoire | 32.8 |
| Mozambique | 31.7 |
| Eritrea | 31.7 |
| Kenya | 30.8 |
| Chad | 28.1 |
| Turkey | 26.3 |
| Haiti | 26.1 |
| Former Soviet States | |
|---|---|
| Ukraine | 49.6 |
| Belarus | 48.5 |
| Armenia | 48.3 |
| Moldova | 42.7 |
| Kazakhstan | 40.9 |
| Georgia | 39.1 |
| Azerbaijan | 38.6 |
| Uzbekistan | 38.2 |
| Russia | 37.5 |
| Tajikistan | 37.1 |
JSON File:
EPI Report Year:
2022
EPI ISO3:
UKR