About the EPI
The 2024 Environmental Performance Index (EPI) provides a data-driven summary of the state of sustainability around the world. Using 58 performance indicators across 11 issue categories, the EPI ranks 180 countries on climate change performance, environmental health, and ecosystem vitality. These indicators provide a gauge at a national scale of how close countries are to established environmental policy targets. The EPI offers a scorecard that highlights leaders and laggards in environmental performance and provides practical guidance for countries that aspire to move toward a sustainable future.
EPI indicators provide a way to spot problems, set targets, track trends, understand outcomes, and identify best policy practices. Going beyond the aggregate scores and drilling down into the data to analyze performance by issue category, policy objective, peer group, and country offers even greater value for policymakers. This granular view and comparative perspective can assist in understanding the determinants of environmental progress and in refining policy choices.
Funding from the McCall MacBain Foundation supports the EPI work at both Yale and Columbia. The EPI research team is deeply grateful for this generous support.
Suggested Citation
Block, S., Emerson, J. W., Esty, D. C., de Sherbinin, A., Wendling, Z. A., et al. (2024). 2024 Environmental Performance Index. New Haven, CT: Yale Center for Environmental Law & Policy. epi.yale.edu
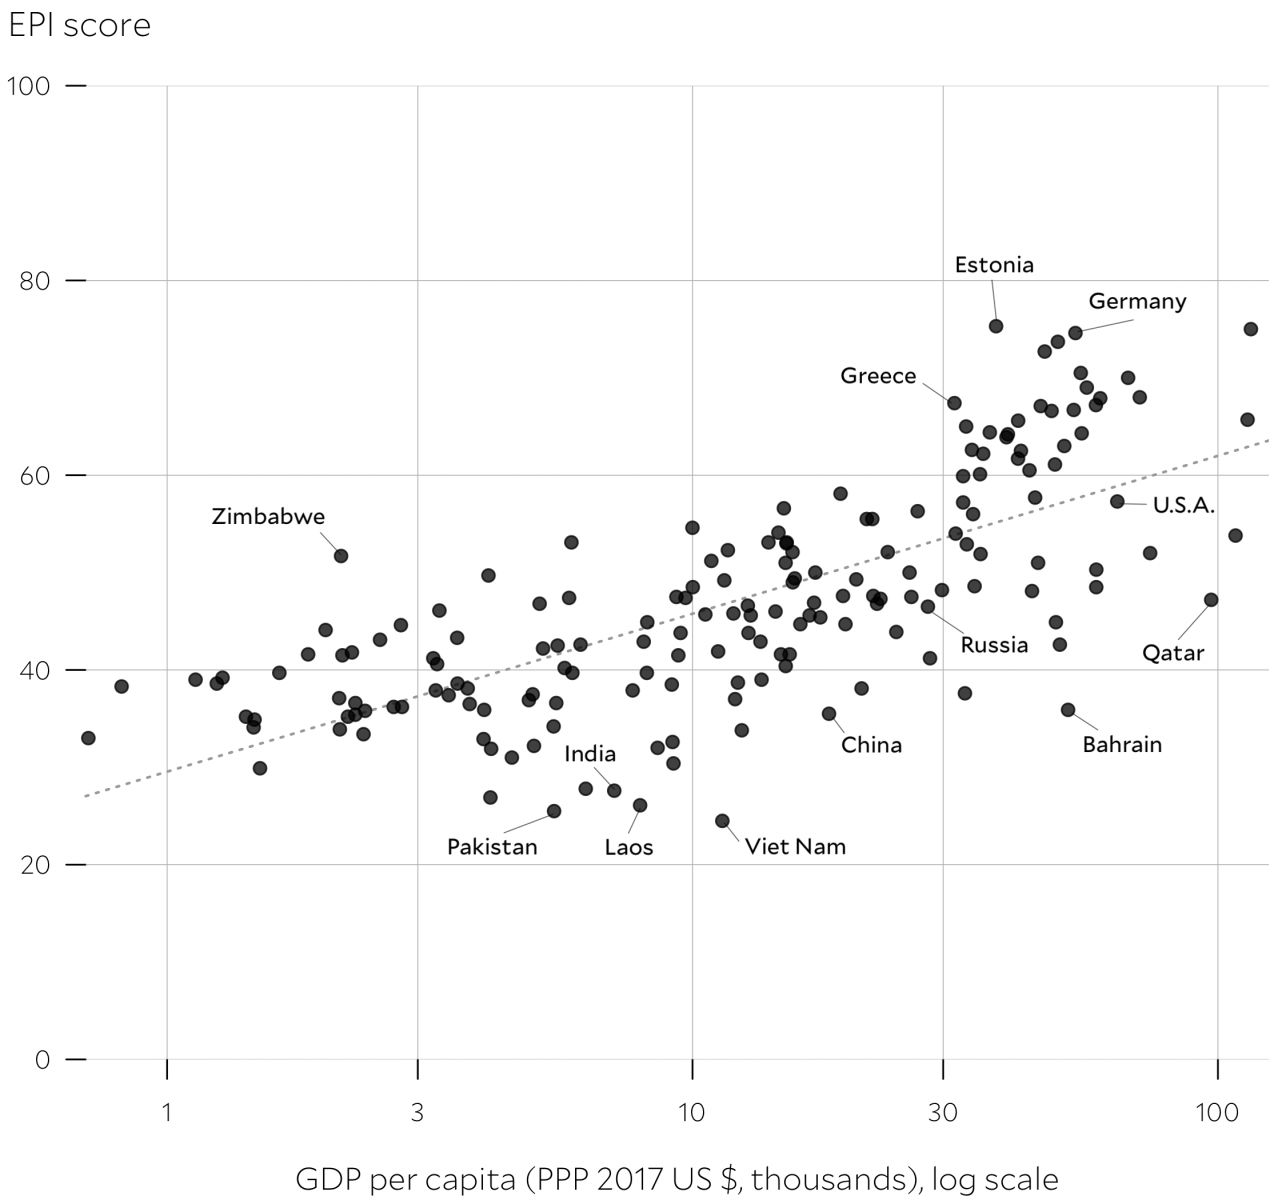
Figure EPI scores vs GDP per capita
Countries’ wealth is a strong predictor of their overall environmental performance, but some countries vastly outperform their eco-nomic peers, while others lag.
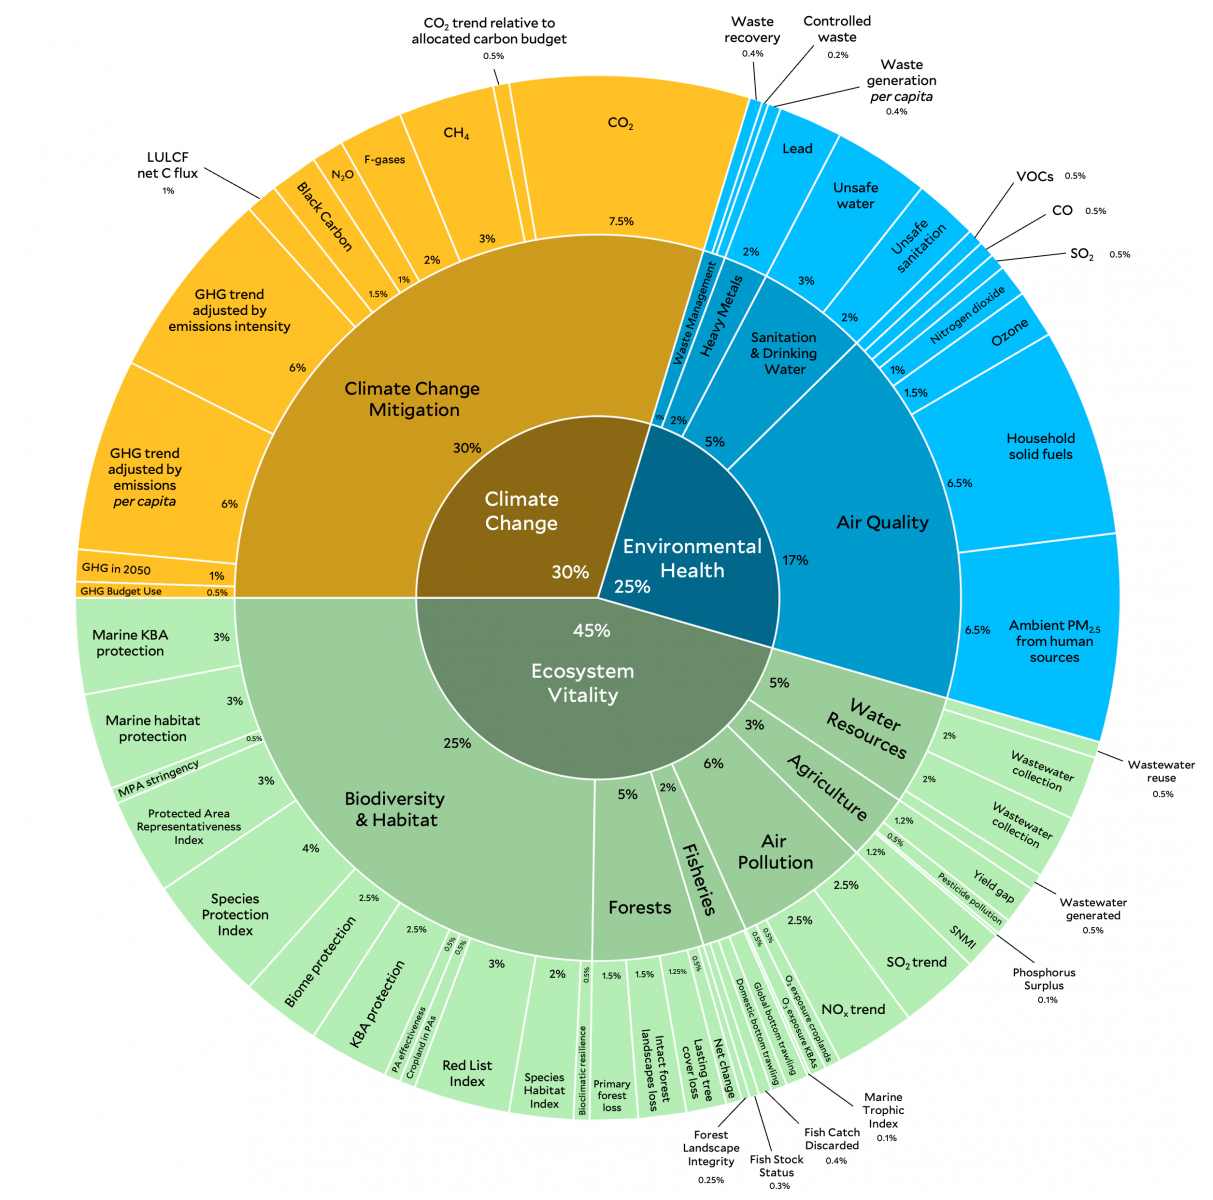
2024 EPI Framework
The framework organizes 58 indicators into 11 issue categories and three policy objectives, with weights shown at each level as a percentage of the total score.