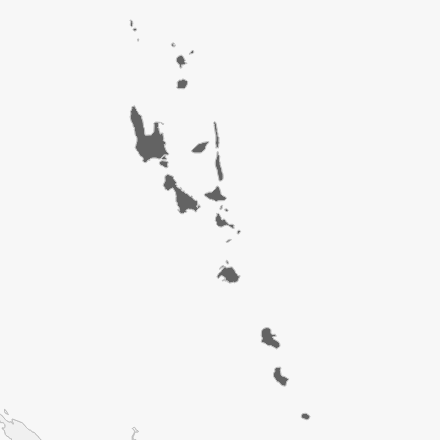
Vanuatu
RegionAsia-Pacific
GDP0.84[PPP 2011$ billions]
GDP per capita2858.20[$]
Population0.29[millions]
Urbanization25.52[%]
Land Area12428.29[sq. km]
Country Scorecard
Peer Comparisons
EPI Scores for this country and peers based on similar characteristics
| EPI Performance | |
|---|---|
| Benin | 30 |
| Angola | 29.7 |
| Togo | 29.5 |
| Mali | 29.4 |
| Guinea-Bissau | 29.1 |
| Bangladesh | 29 |
| Vanuatu | 28.9 |
| Djibouti | 28.1 |
| Lesotho | 28 |
| Gambia | 27.9 |
| GDP per capita | |
|---|---|
| Tajikistan | 38.2 |
| Zimbabwe | 37 |
| Kenya | 34.7 |
| Micronesia | 33 |
| Nepal | 32.7 |
| Comoros | 32.1 |
| Tanzania | 31.1 |
| Senegal | 30.7 |
| Vanuatu | 28.9 |
| Lesotho | 28 |
| Issue Performance | |
|---|---|
| Guyana | 35.9 |
| Papua New Guinea | 32.4 |
| Comoros | 32.1 |
| Guatemala | 31.8 |
| Angola | 29.7 |
| Bangladesh | 29 |
| Vanuatu | 28.9 |
| Gambia | 27.9 |
| India | 27.6 |
| Haiti | 27 |
| Regulatory Quality | |
|---|---|
| Russia | 50.5 |
| Tunisia | 46.7 |
| Honduras | 37.8 |
| Guyana | 35.9 |
| Maldives | 35.6 |
| Zambia | 34.7 |
| Cambodia | 33.6 |
| Papua New Guinea | 32.4 |
| Vanuatu | 28.9 |
| Lesotho | 28 |
| Voice & Accountability | |
|---|---|
| Croatia | 63.1 |
| Argentina | 52.2 |
| Trinidad and Tobago | 47.5 |
| Panama | 47.3 |
| Tonga | 45.1 |
| Grenada | 43.1 |
| Namibia | 40.2 |
| Vanuatu | 28.9 |
| Ghana | 27.6 |
| Solomon Islands | 26.7 |
| Political Stability | |
|---|---|
| Netherlands | 75.3 |
| Croatia | 63.1 |
| Taiwan | 57.2 |
| Saint Vincent and the Grenadines | 48.4 |
| Mauritius | 45.1 |
| Tonga | 45.1 |
| Bahamas | 43.5 |
| Mongolia | 32.2 |
| Marshall Islands | 30.8 |
| Vanuatu | 28.9 |
| Asia-Pacific | |
|---|---|
| Fiji | 34.4 |
| Cambodia | 33.6 |
| Viet Nam | 33.4 |
| Micronesia | 33 |
| Papua New Guinea | 32.4 |
| Mongolia | 32.2 |
| Marshall Islands | 30.8 |
| Vanuatu | 28.9 |
| Solomon Islands | 26.7 |
| Myanmar | 25.1 |
| Small Island Developing States | |
|---|---|
| Fiji | 34.4 |
| Micronesia | 33 |
| Cabo Verde | 32.8 |
| Papua New Guinea | 32.4 |
| Comoros | 32.1 |
| Marshall Islands | 30.8 |
| Guinea-Bissau | 29.1 |
| Vanuatu | 28.9 |
| Haiti | 27 |
| Solomon Islands | 26.7 |
| Ease of Doing Business Index | |
|---|---|
| Jordan | 53.4 |
| Uruguay | 49.1 |
| Trinidad and Tobago | 47.5 |
| Dominica | 44.6 |
| Namibia | 40.2 |
| Philippines | 38.4 |
| Malawi | 38.3 |
| Fiji | 34.4 |
| Vanuatu | 28.9 |
| Ghana | 27.6 |
JSON File:
EPI Report Year:
2020
EPI ISO3:
VUT
