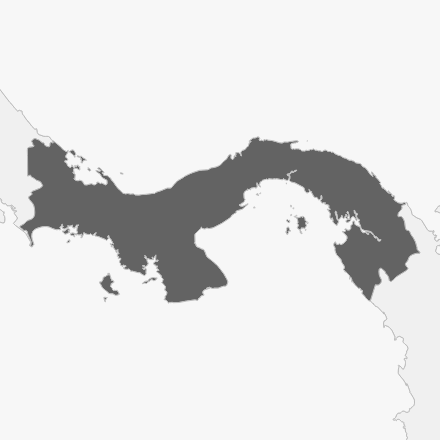
Panama
RegionLatin America & Caribbean
GDP94.71[PPP 2011$ billions]
GDP per capita22674.40[$]
Population4.18[millions]
Urbanization68.41[%]
Land Area75587.77[sq. km]
Country Scorecard
Peer Comparisons
EPI Scores for this country and peers based on similar characteristics
| EPI Performance | |
|---|---|
| Jamaica | 48.2 |
| Iran | 48 |
| Malaysia | 47.9 |
| Trinidad and Tobago | 47.5 |
| Panama | 47.3 |
| Tunisia | 46.7 |
| Azerbaijan | 46.5 |
| Paraguay | 46.4 |
| Dominican Republic | 46.3 |
| Montenegro | 46.3 |
| GDP per capita | |
|---|---|
| Greece | 69.1 |
| Romania | 64.7 |
| Croatia | 63.1 |
| Chile | 55.3 |
| Uruguay | 49.1 |
| Antigua and Barbuda | 48.5 |
| Cuba | 48.4 |
| Panama | 47.3 |
| Mauritius | 45.1 |
| Kazakhstan | 44.7 |
| Issue Performance | |
|---|---|
| Belarus | 53 |
| Mexico | 52.6 |
| Costa Rica | 52.5 |
| Cuba | 48.4 |
| Jamaica | 48.2 |
| Panama | 47.3 |
| Thailand | 45.4 |
| Peru | 44 |
| Nicaragua | 39.2 |
| Philippines | 38.4 |
| Regulatory Quality | |
|---|---|
| Romania | 64.7 |
| Croatia | 63.1 |
| Colombia | 52.9 |
| Costa Rica | 52.5 |
| Bahrain | 51 |
| Antigua and Barbuda | 48.5 |
| Panama | 47.3 |
| Montenegro | 46.3 |
| Botswana | 40.4 |
| Oman | 38.5 |
| Voice & Accountability | |
|---|---|
| Argentina | 52.2 |
| Antigua and Barbuda | 48.5 |
| Jamaica | 48.2 |
| Trinidad and Tobago | 47.5 |
| Panama | 47.3 |
| Tonga | 45.1 |
| Grenada | 43.1 |
| Vanuatu | 28.9 |
| Ghana | 27.6 |
| Solomon Islands | 26.7 |
| Political Stability | |
|---|---|
| Spain | 74.3 |
| Italy | 71 |
| Belarus | 53 |
| Albania | 49 |
| Malaysia | 47.9 |
| Trinidad and Tobago | 47.5 |
| Panama | 47.3 |
| Timor-Leste | 35.3 |
| Viet Nam | 33.4 |
| Solomon Islands | 26.7 |
| Latin America & Caribbean | |
|---|---|
| Uruguay | 49.1 |
| Antigua and Barbuda | 48.5 |
| Cuba | 48.4 |
| Saint Vincent and the Grenadines | 48.4 |
| Jamaica | 48.2 |
| Trinidad and Tobago | 47.5 |
| Panama | 47.3 |
| Paraguay | 46.4 |
| Dominican Republic | 46.3 |
| Barbados | 45.6 |
| Org. of Ibero-American States | |
|---|---|
| Brazil | 51.2 |
| Ecuador | 51 |
| Venezuela | 50.3 |
| Uruguay | 49.1 |
| Cuba | 48.4 |
| Panama | 47.3 |
| Paraguay | 46.4 |
| Dominican Republic | 46.3 |
| Bolivia | 44.3 |
| Peru | 44 |
| Ease of Doing Business Index | |
|---|---|
| Greece | 69.1 |
| Albania | 49 |
| Panama | 47.3 |
| Tunisia | 46.7 |
| Uzbekistan | 44.3 |
| South Africa | 43.1 |
| Botswana | 40.4 |
| Qatar | 37.1 |
| Mongolia | 32.2 |
| India | 27.6 |
JSON File:
EPI Report Year:
2020
EPI ISO3:
PAN
