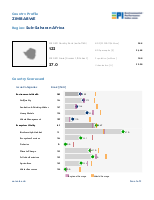
Zimbabwe
RegionSub-Saharan Africa
GDP38.82[PPP 2011$ billions]
GDP per capita2688.41[$]
Population14.44[millions]
Urbanization32.24[%]
Land Area392719.77[PPP 2011$ billions]
Country Scorecard
Peer Comparisons
EPI Scores for this country and peers based on similar characteristics
| EPI Performance | |
|---|---|
| Zimbabwe | 37 |
| Qatar | 37 |
| China | 37 |
| Samoa | 37 |
| Sao Tome and Principe | 37 |
| Kiribati | 37 |
| Honduras | 37 |
| Indonesia | 37 |
| Central African Republic | 36 |
| Dem. Rep. Congo | 36 |
| GDP per capita | |
|---|---|
| Tajikistan | 38 |
| Zimbabwe | 37 |
| Kenya | 34 |
| Micronesia | 33 |
| Nepal | 32 |
| Comoros | 32 |
| Tanzania | 31 |
| Lesotho | 28 |
| Vanuatu | 28 |
| Gambia | 27 |
| Issue Performance | |
|---|---|
| Malawi | 38 |
| Zimbabwe | 37 |
| Central African Republic | 36 |
| Dem. Rep. Congo | 36 |
| Uganda | 35 |
| Zambia | 34 |
| Mozambique | 33 |
| Benin | 30 |
| Senegal | 30 |
| Guinea-Bissau | 29 |
| Regulatory Quality | |
|---|---|
| Cuba | 48 |
| Iran | 48 |
| Algeria | 44 |
| Equatorial Guinea | 38 |
| Zimbabwe | 37 |
| Dem. Rep. Congo | 36 |
| Central African Republic | 36 |
| Sudan | 34 |
| Republic of Congo | 30 |
| Haiti | 27 |
| Voice & Accountability | |
|---|---|
| United Arab Emirates | 55 |
| Kazakhstan | 44 |
| Nicaragua | 39 |
| Zimbabwe | 37 |
| Qatar | 37 |
| Central African Republic | 36 |
| Ethiopia | 34 |
| Rwanda | 33 |
| Cameroon | 33 |
| Republic of Congo | 30 |
| Political Stability | |
|---|---|
| Azerbaijan | 46 |
| Thailand | 45 |
| Tajikistan | 38 |
| Zimbabwe | 37 |
| Uganda | 35 |
| Mozambique | 33 |
| Papua New Guinea | 32 |
| Guinea-Bissau | 29 |
| Mauritania | 27 |
| Haiti | 27 |
| Sub-Saharan Africa | |
|---|---|
| Equatorial Guinea | 38 |
| Burkina Faso | 38 |
| Malawi | 38 |
| Zimbabwe | 37 |
| Sao Tome and Principe | 37 |
| Central African Republic | 36 |
| Dem. Rep. Congo | 36 |
| Uganda | 35 |
| Kenya | 34 |
| Zambia | 34 |
| Landlocked Developing Countries | |
|---|---|
| Bhutan | 39 |
| Tajikistan | 38 |
| Burkina Faso | 38 |
| Malawi | 38 |
| Zimbabwe | 37 |
| Central African Republic | 36 |
| Uganda | 35 |
| Laos | 34 |
| Zambia | 34 |
| Ethiopia | 34 |
| Ease of Doing Business Index | |
|---|---|
| Bolivia | 44 |
| Algeria | 44 |
| Burkina Faso | 38 |
| Zimbabwe | 37 |
| Laos | 34 |
| Marshall Islands | 30 |
| Benin | 30 |
| Niger | 30 |
| Mauritania | 27 |
| Guinea | 26 |
PDF Download
JSON File:
EPI Report Year:
2020
EPI ISO3:
ZWE