
Methodology
1. Introduction
Composite indices, such as the Environmental Performance Index (EPI), synthesize many variables into a single number to ease communication about and interpretation of complex subjects. Doing so, however, risks losing information and obscuring the science upon which we rely. To address this challenge, this methodology describes the decisions and techniques used to construct the 2026 EPI, from data selection and indicator construction to weighting, aggregation, and other considerations. The OECD handbook on composite indicators (Nardo et al. 2008) serves as an authoritative guide to best practices in composite indicator design, to which we have adhered to as closely as possible. The EPI is meant to be an analytically rigorous, methodologically sound tool grounded in the best available data.
The EPI team is committed to transparency, clarity, and reproducibility. Readers interested in exploring our methodology in greater depth can find additional materials at this website. All of the tabular data, indicator scores, and supplementary files can be downloaded for inspection and analysis. The Technical Appendix provides additional information on metadata, targets, weights, indicator calculations, missing data imputation, materiality filters, and geographic and temporal coverage. We aim to provide sufficient detail for any researcher to replicate our results, evaluate our assumptions, or construct alternative approaches and results.
Constructing a composite index necessarily involves making judgments among plausible alternative choices about many methodological decisions. While we strive to make good ones, we acknowledge that there is no single, correct set of answers. The 2026 EPI is the product of the latest advances in environmental science, trial approaches to novel datasets, refined thinking about past decisions – and feedback about previous versions of the Index. We welcome questions, constructive criticism, and suggestions for how to improve any aspect of the EPI.
2. Data Selection
Advances in environmental science, remote sensing, and data reporting continue to expand the quantity and quality of information available to assess sustainability. Each edition of the EPI seeks to incorporate the best available evidence to produce credible and policy-relevant measures of environmental performance. This section describes the criteria used to identify reliable and appropriate datasets.
2.1 Inclusion criteria
Each metric in the EPI tracks a specific dimension of environmental sustainability. The underlying data must permit meaningful comparisons across countries and through time while measuring outcomes that matter for policy. To support these objectives, the EPI applies the following criteria when evaluating potential datasets.
- Relevance. Data should measure something about the environment that is applicable to most countries in most circumstances.
- Performance orientation. Data should measure environmental issues that policy interventions can influence. Countries should not be penalized for environmental conditions or resource endowments beyond their control. Indicators should also measure on-the-ground outcomes from policies rather than policy inputs. If direct measurement of outcomes is not possible, proxy measurements that are causally related to those outcomes may be acceptable substitutes.
- Established methodology. Data should derive from methods that have undergone scientific scrutiny through peer review or endorsement by an international organization. Consistent methodology is essential for comparison across countries and years.
- Verification. Data should be independently verified or produced through transparent systems that allow for external review and audit. The EPI generally does not rely on data submitted directly by national governments without such safeguards.
- Spatial completeness. Data should cover a substantial share of the world’s countries and apply a common methodology across regions. Limited geographic coverage reduces the usefulness of global comparisons. Some datasets are only available at the regional level or for a subset of countries, e.g., the European Union, which we unfortunately cannot include, even if they measure an important issue.
- Temporal completeness. Data should extend across multiple years and demonstrate a commitment to continued collection and reporting. Longitudinal records permit the evaluation of environmental progress over time.
- Recency. Data should reflect the most current information available. Recent observations provide a more accurate picture of environmental conditions – and may provide timely insights about the outcomes of policy interventions.
- Open access. Data should be freely available to researchers, policymakers, and the public. Open data strengthen transparency, broaden participation, and facilitate independent replication.
No dataset satisfies every criterion perfectly. In some cases, an environmental issue may be sufficiently important that an imperfect metric provides more value than no measurement at all. In other cases, emerging topics may require the use of pilot indicators while global monitoring systems continue to mature. In such cases, the EPI clearly identifies the limitations of the underlying data and encourages continued investment in improved measurement systems.
2.2 Data sources
Data that satisfy the EPI inclusion criteria typically come from international organizations, research institutions, academic collaborations, and government agencies. These organizations use a variety of approaches to collect, curate, and verify information on environmental conditions and sustainability outcomes:
- Remotely sensed observations from satellites and other earth observation systems;
- Measurements from ground-based monitoring stations;
- Surveys and questionnaires;
- Estimates derived from field measurements and statistical models;
- Industry reports on resource use, production, and pollutant emissions; and
- Government statistics reported through international organizations and other transparent data systems.
The Technical Appendix documents the sources underlying each indicator in the 2026 EPI, together with information on data coverage, methodology, and any processing steps.
3. Country Coverage
The EPI pays close attention to questions of sovereignty and territorial coverage when evaluating environmental performance. We seek global datasets with sufficient spatial resolution to assess countries and major territories using consistent methods. Most data sources identify observations using official ISO 3166 codes. Country definitions and political boundaries evolve over time, and historical datasets sometimes include entities that no longer exist or that have subsequently divided into multiple successor states. When appropriate, we assign historical values to successor countries to preserve continuity in long-term records. Comparisons across periods of changing political geography nevertheless require caution.
Territories governed, administered, or protected by other countries present additional challenges. Although the EPI focuses on country-level performance, environmental policymaking occurs across multiple levels of government. We therefore consider factors such as policy autonomy, statistical reporting practices, and customary treatment in international datasets when determining whether a territory merits separate inclusion in the EPI database. When possible, we include major territories as distinct observations, even when data limitations preclude the calculation of a complete EPI score.
The decision to include a country in the EPI rests on two principal considerations. First, we must have data on a sufficient number of crucial indicators to support the calculation of the index. Rather than requiring a fixed threshold of a number of indicators, we evaluate the weight of missing indicators, the feasibility of imputing missing values, the proportion of the final score that would depend on imputation, the potential bias introduced by those imputations, and the reasons the data are missing. Materiality alone does not lead to exclusion from the EPI. Second, we may exclude countries experiencing severe and exceptional political instability when such conditions are likely to compromise the quality or representativeness of the available data or render them unsuitable for evaluating environmental policy performance.
The raw data files underlying the 2026 EPI contain information for 220 countries and territories and are available for download from this website. The Technical Appendix provides additional details on territorial treatment, data aggregation, and country coverage.
The decisions required to assemble country-level datasets carry important political sensitivities. Nothing in the EPI should be interpreted as an endorsement or rejection of claims to sovereignty, autonomy, or international recognition. These choices reflect practical considerations necessary for statistical analysis and are made with appropriate care and caution.
4. Indicator Construction
Policymaking is best supported by data when it is communicated clearly to decisionmakers, researchers, the media, and the public. To this end, the EPI transforms complex environmental datasets into simple indicators that gauge sustainability progress, scoring each country on a scale from 0 (worst performance) to 100 (best performance). Some datasets used by the EPI already exist as metrics that intuitively gauge countries in this way, but most require additional calculations and processing to become scaled indicators. The EPI report describes each indicator in some detail, and the Technical Appendix provides further descriptions and explanations about our calculations. The sections below give a broad overview of the 2026 EPI data framework, outlining the methodological decisions made to transform raw data into indicators.
4.1 Standardization
Because countries vary widely in the size of their land area, economy, and population, metrics are most useful when they can allow for fair cross-country comparisons. Most frequently, denominating variables by an appropriate factor, such as population, results in proportions, ratios, or rates that put every country on the same scale. Environmental health data from the Global Burden of Disease, for example, measure health burdens of environmental factors in units of age-standardized Disability-Adjusted Life Years lost per 100,000 residents (DALY rate), allowing countries with populations that vary in age to be compared fairly. Several EPI indicators are trend-based, scoring countries on rates of change rather than absolute values.
4.2 Transformation
On some environmental issues, a few countries perform either extremely well (or extremely poorly) while the rest of the world is clustered at the other end of the scale. This skewed distribution makes it difficult to compare performance, since countries appear to be almost indistinguishable from each other except for the outliers. In these cases, the EPI uses transformations, usually logarithmic, to spread out the scores of countries clustered at one end of the distribution and improve the interpretation of results. Without this transformation, many countries’ relative performance would be imperceptible, and it would be difficult to draw meaningful distinctions between them.
4.3 Scoring
After the EPI team standardizes and transforms the raw data, the final step is to convert it into a score ranging from 0 to 100. This places all indicators on a shared, intuitive scale that can be compared and aggregated into a composite index. To assign these scores, the EPI relies on a distance-to-target method, in which each country’s score reflects where its value falls relative to targets for best and worst performance. The general formula for indicator scoring is
Indicator Score = (X – W) / (B – W) × 100
where X is a country’s value, B is the target for best performance, and W is the target for worst performance. If a country’s value exceeds B, its score is capped at 100, and if the value falls below W, the score is set to 0. Having these upper and lower bounds prevents outliers from having outsize influence on the scores of other countries.
The EPI selects benchmarks for best and worst performance according to the following order of priority:
- Performance targets established by international agreements, treaties, or institutions. Where none exist, the EPI turns to …
- Performance targets recommended by experts in the field. Where no such guidance is available, the EPI turns to …
- Performance targets based on percentiles of country scores, typically the 95th or 99th percentile for best performance and the 1st or 5th percentile for worst performance, depending on the distribution of the indicator data.
Since international agreements and experts rarely define standards of worst performance, the EPI most frequently relies on percentiles for worst-performance targets. When calculating these percentiles, the EPI uses data from the entire array of all available years and countries for each indicator, not just the latest year or the set of countries included in the EPI. Further details on the performance targets used for each indicator can be found in the Technical Appendix.
5. 2026 EPI Framework
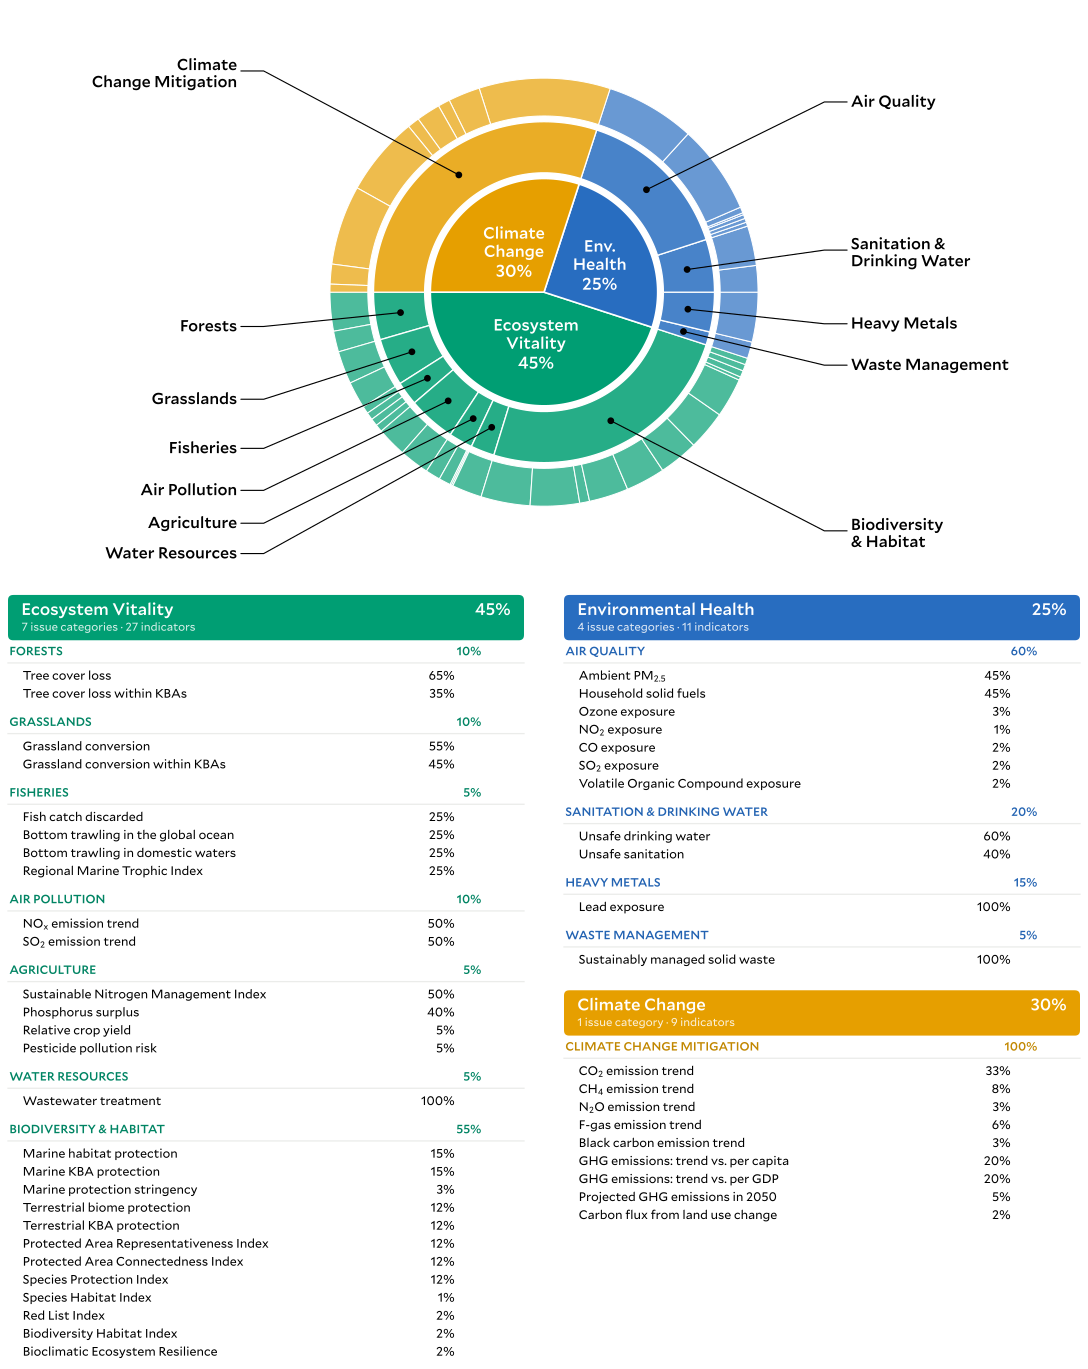
Constructing a composite index requires establishing a clear framework for organizing the underlying components. The 2026 EPI uses a hierarchy in which 47 indicators nest within 12 issue categories, which further aggregate into three policy objectives that underpin the overall index. The higher levels of aggregation track how citizens, policymakers, and other stakeholders generally deal with environmental issues. For example, government ministries or bureaus are devoted to natural resources like fisheries and forests, or non-profit organizations may form around specific threats to human health or even global problems like climate change. Top-level EPI scores, then, are a starting point for conversations about the components of environmental performance, and this website provides tools for drilling deeper into country scores at every level of the EPI framework, down to specific indicators.
6. Weighting and Aggregation
Calculating a country’s overall EPI score involves aggregating all performance indicators, issue categories, and policy objectives into a single composite score, which requires assigning a weight to each component. The literature on composite indices offers a range of approaches to weighting and aggregation (Munda, 2012; Munda & Nardo, 2009; Nardo et al., 2008), but the EPI uses an arithmetic mean, prioritizing simplicity and ease of interpretation. The weights applied to EPI scores reflect a combination of factors: the perceived importance of each issue, the quality and timeliness of the data, and statistical analysis aimed at balancing the spread of scores. The weights used in the 2026 version of the Index represent just one possible structure, and the EPI encourages readers to view these weights as suggestions rather than a fixed standard. The 2026 EPI data are available for download at this website for further analysis.
Although the EPI regards each policy objective as a critically important dimension of environmental sustainability, they are not weighted equally in the overall index. If each policy objective received one-third of the total weight, Environmental Health would exert a disproportionate influence because country scores vary much more widely than they do for the other objectives. In the 2026 EPI, the variance of Environmental Health scores (467.15) is substantially larger than that of Climate Change (281.56) and Ecosystem Vitality (123.02). Without adjustment, differences in Environmental Health performance would dominate overall EPI scores, reducing the influence of meaningful variation in the other two policy objectives. To produce a more balanced index, the 2026 EPI assigns weights of 25 percent to Environmental Health, 30 percent to Climate Change, and 45 percent to Ecosystem Vitality. These weights should not be interpreted as ranking one policy objective above another. Rather, they are intended to ensure that each contributes meaningfully to the overall index despite differences in the statistical distribution of country scores.
Within policy objectives, we assign weights to issue categories based on empirical analysis, subjective judgement of importance, and data quality. For Environmental Health, the underlying data show that, globally, the health burden from Air Quality issues is over thrice that of Sanitation & Drinking Water, which is only slightly higher than Heavy Metals. We have no directly comparable data on the health burden from Waste Management, and its relatively low weight in the policy objective reflects the sparseness and quality of the data. For Ecosystem Vitality, the weights are less empirically grounded, reflecting instead a balance between the strength of the data in filling our gaps in understanding of each issue and the relative influence of each issue category in international discussions about environmental performance.
7. Materiality
Since countries differ substantially in their ecosystems, geography, and natural resource endowments, not every indicator can apply to every country. In these cases, countries receive no score for the affected indicators and issue categories, and the weight of these components is reapportioned to other components of the EPI within the same level of aggregation.
- Landlocked countries receive no score for Fisheries or indicators related to marine protected areas.
- Further, countries that do not have important marine and coastal habitats within their marine zone(s) are not scored on the marine habitat protection indicator.
- Countries with less than 2,000 hectares of tree cover in 2000 are not scored for Forests or the indicator on net carbon flux from changes in land use.
- Countries with less than 50 hectares of grassland extent in 2000 are not scored for Grasslands indicators.
- Countries in which 17 major crops require less than 5% of the total area of harvested land are not scored for the indicator on relative crop yield.
8. Missing Data
While the EPI aims to use datasets that are as spatially and temporally complete as possible, the reality of environmental data collection is that sometimes the EPI must use datasets that have missing entries for certain countries. In some instances, this results from materiality, as detailed above. In other instances, such as with the Species Habitat Index, the metric cannot be accurately calculated for very small countries. In each of these cases, the EPI assigns the missing indicator a weight of zero and redistributes that weight to the other indicators in the issue category during the aggregation step.
This approach becomes more complicated for issue categories built on a single indicator, such as Waste Management and Water Resources, where the missing data cannot be offset by other indicators in the same category. Here, the EPI calculates the missing values using statistical models, regional averages, or other reasonable assumptions, detailed in the Technical Appendix. We did the same for missing values in the Agriculture category for the Sustainable Nitrogen Management Index and phosphorus surplus indicators. Even though this category has multiple indicators, substantial variation among the scores of indicators raised concerns that different countries being scored on different subsets of indicators could lead to bias in the results. We therefore urge users to exercise caution in comparing countries in all three of these issue categories.
9. Backcasting
The most recent EPI scores capture the state of global sustainability based on the latest available data, but researchers and policymakers are often just as interested in performance throughout time. These longitudinal data can help clarify if policies and investments in sustainability programs are effective and identify areas where performance is worsening. Unfortunately, the EPI does not produce panel datasets of top-level scores, as not all datasets exist as continuous time series, and those that do often begin and end in different years. Constructing synchronized time series for all indicators falls outside of the scope of the EPI’s analysis and risks generating misleading results. Techniques like extending fixed values across a time horizon or linear interpolation, or even more exotic methods, could obscure or misrepresent actual changes in real-world conditions. Instead, we recommend that research agendas should refocus on specific issue categories and indicator scores for which there is sufficient temporal coverage. Further information about these datasets is available in our Technical Appendix and the data files available for download at this website.
To offer some insight into performance over time, the EPI reports changes in scores over an approximate ten-year window, applying the 2026 methods to historical data, when available, and calculating the difference between current scores and these past snapshots.
10. Changes From the 2024 EPI
Every iteration of the EPI requires changes to the methodology. Innovation allows the EPI to take advantage of the latest advances in environmental science and analysis. We introduce new datasets, better standardizations, expanded country coverage, and other updates to increase the sophistication and usefulness of the index. Not every innovation endures, however, and the 2026 EPI, like previous iterations, learns from and drops experiments that are obsolete or problematic. In the interest of a more robust tool, we welcome feedback on every version of the EPI.
Changes in methodology between versions of the EPI mean that historical EPI scores are not comparable. Differences in country scores and ranks across EPI iterations are largely due to additions and subtractions of indicators, new weighting schemes, and other aspects of the methodology – not necessarily to decreased or increased performance. We therefore admonish users not to compare EPI scores or sub-scores across versions. Attempting to assemble time series or panel data of EPI scores from current and past versions of the EPI is strictly inappropriate. True within-country changes in performance are better assessed with time series of the raw data for individual indicators, when available.
The 2026 EPI refocuses on a set of 47 indicators, with 19 subtractions and 8 additions from the 2024 EPI.
- In Air Quality, we reverted from a pilot indicator on exposure to anthropogenic particulate matter to our previous indicator on the health burden from exposure to PM2.5. Discerning the proportion of particulate matter from human sources remains important, and we hope that new, more recent estimates of this metric will be available on an on-going basis.
- In Waste Management, we have dropped metrics on generation per capita and waste recovery.
- In Biodiversity & Habitat, we have paused calculating protected area effectiveness and protected human land. As pilot indicators, we produced these metrics in hopes that they would spark important discussions about how to measure encroachment into protected areas and the human-wildlife interface, and we expect further refinements that lead to more informative metrics. In the 2026 EPI, we reïntroduce the Biodiversity Habitat Index and include the new Protected Area Connectedness Index.
- In Forests, we replace metrics on primary forest loss, intact forest landscape loss, tree cover loss weighted by permanency, and net change in tree cover with two indicators: tree cover loss (as used in previous versions of the EPI) and tree cover loss within Key Biodiversity Areas.
- Grasslands is a new issue category, consisting of two indicators: grassland conversion (permanent loss) and grassland conversion within Key Biodiversity Areas.
- In Fisheries, we drop the indicator on fish stock status, as forthcoming innovations in metrics have led to a reconsideration of its relevance to measuring environmental performance.
- In Air Pollution, we dropped pilot indicators on ozone exposure in Key Biodiversity Areas and in croplands.
- In Water Resources, we dropped indicators on wastewater generation, collection, and reuse.
- In Climate Change Mitigation, we dropped pilot indicators on CO2 emission trends with country-specific targets and projected cumulative emissions to 2050 relative to the carbon budget. The indicator on projected emissions in 2050 is now measured as a percentage of current emissions rather than in absolute terms.
Further refinements to the 2026 EPI spring from how we review all aspects of our methods, including reviewing alternative data partners; refreshing datasets with the latest updated values; and revisiting decisions about transformations, targets, weights, and country coverage. The report and the Technical Appendix provide details about all of our choices. Feedback on any aspect of the construction of the 2026 EPI – or how we explain our methodology and justify our decisions – is crucial for sharpening our thinking and expanding the accessibility of the Index for wide audiences. We invite readers, researchers, and users to join us in regearing the EPI for a new era of transformative data and analytics with suggestions, critiques, and questions we have failed to clarify in our documentation.
11. Works Cited
Munda, G. (2012). Choosing Aggregation Rules for Composite Indicators. Social Indicators Research, 109(3), 337–354. https://doi.org/10.1007/s11205-011-9911-9
Munda, G., & Nardo, M. (2009). Noncompensatory/nonlinear composite indicators for ranking countries: A defensible setting. Applied Economics, 41(12), 1513–1523. https://doi.org/10.1080/00036840601019364
Nardo, M., Saisana, M., Saltelli, A., Tarantola, S., Hoffmann, A., & Giovannini, E. (2008). Handbook on constructing composite indicators: Methodology and user guide. OECD.