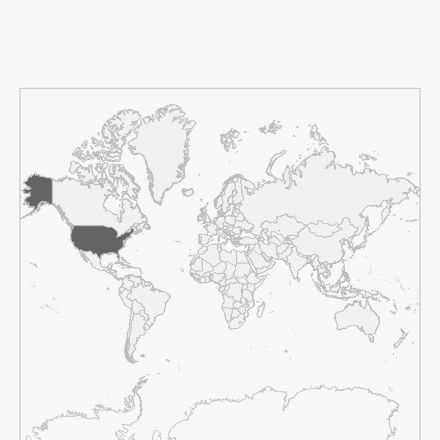
United States of America
RegionGlobal West
GDP18341.58[PPP 2011$ billions]
GDP per capita55454.91[$]
Population330.75[millions]
Urbanization82.66[%]
Land Area9498570.76[sq. km]
Country Scorecard
Peer Comparisons
EPI Scores for this country and peers based on similar characteristics
| EPI Performance | |
|---|---|
| Slovenia | 72 |
| New Zealand | 71.3 |
| Canada | 71 |
| Czech Republic | 71 |
| Italy | 71 |
| Malta | 70.7 |
| United States of America | 69.3 |
| Greece | 69.1 |
| Slovakia | 68.3 |
| Portugal | 67 |
| GDP per capita | |
|---|---|
| Denmark | 82.5 |
| Switzerland | 81.5 |
| Austria | 79.6 |
| Sweden | 78.7 |
| Germany | 77.2 |
| Netherlands | 75.3 |
| Iceland | 72.3 |
| United States of America | 69.3 |
| Kuwait | 53.6 |
| Saudi Arabia | 44 |
| Issue Performance | |
|---|---|
| France | 80 |
| Australia | 74.9 |
| Ireland | 72.8 |
| New Zealand | 71.3 |
| Canada | 71 |
| Czech Republic | 71 |
| Italy | 71 |
| United States of America | 69.3 |
| Slovakia | 68.3 |
| Croatia | 63.1 |
| Regulatory Quality | |
|---|---|
| Denmark | 82.5 |
| Luxembourg | 82.3 |
| Austria | 79.6 |
| Norway | 77.7 |
| Germany | 77.2 |
| Ireland | 72.8 |
| Iceland | 72.3 |
| Canada | 71 |
| United States of America | 69.3 |
| Estonia | 65.3 |
| Voice & Accountability | |
|---|---|
| Japan | 75.1 |
| Spain | 74.3 |
| Slovenia | 72 |
| Italy | 71 |
| Malta | 70.7 |
| United States of America | 69.3 |
| Cyprus | 64.8 |
| Taiwan | 57.2 |
| Chile | 55.3 |
| Cabo Verde | 32.8 |
| Political Stability | |
|---|---|
| Belgium | 73.3 |
| United States of America | 69.3 |
| Cyprus | 64.8 |
| Latvia | 61.6 |
| Bulgaria | 57 |
| Chile | 55.3 |
| Costa Rica | 52.5 |
| Jamaica | 48.2 |
| Sao Tome and Principe | 37.6 |
| Laos | 34.8 |
| Global West | |
|---|---|
| Spain | 74.3 |
| Belgium | 73.3 |
| Ireland | 72.8 |
| Iceland | 72.3 |
| New Zealand | 71.3 |
| Canada | 71 |
| Italy | 71 |
| Malta | 70.7 |
| United States of America | 69.3 |
| Portugal | 67 |
| G-20 | |
|---|---|
| United Kingdom | 81.3 |
| France | 80 |
| Germany | 77.2 |
| Japan | 75.1 |
| Australia | 74.9 |
| Canada | 71 |
| Italy | 71 |
| United States of America | 69.3 |
| South Korea | 66.5 |
| Mexico | 52.6 |
| Ease of Doing Business Index | |
|---|---|
| Denmark | 82.5 |
| United Kingdom | 81.3 |
| Sweden | 78.7 |
| Norway | 77.7 |
| United States of America | 69.3 |
| South Korea | 66.5 |
| Singapore | 58.1 |
| United Arab Emirates | 55.6 |
| Malaysia | 47.9 |
| Georgia | 41.3 |
JSON File:
EPI Report Year:
2020
EPI ISO3:
USA
