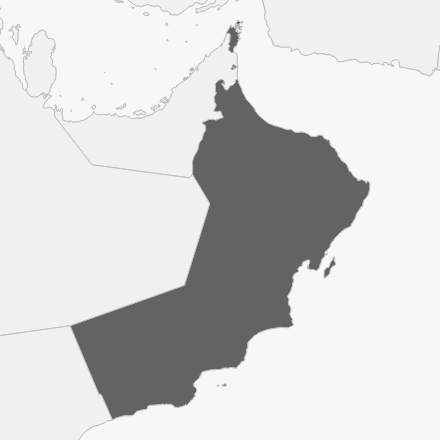
Oman
RegionGreater Middle East
GDP179.38[PPP 2011$ billions]
GDP per capita37143.31[$]
Population4.83[millions]
Urbanization86.28[%]
Land Area310775.72[sq. km]
Country Scorecard
Peer Comparisons
EPI Scores for this country and peers based on similar characteristics
| EPI Performance | |
|---|---|
| Nicaragua | 39.2 |
| Sri Lanka | 39 |
| Oman | 38.5 |
| Philippines | 38.4 |
| Burkina Faso | 38.3 |
| Malawi | 38.3 |
| Tajikistan | 38.2 |
| Equatorial Guinea | 38.1 |
| Honduras | 37.8 |
| Indonesia | 37.8 |
| GDP per capita | |
|---|---|
| United Kingdom | 81.3 |
| France | 80 |
| Japan | 75.1 |
| Spain | 74.3 |
| New Zealand | 71.3 |
| Italy | 71 |
| Malta | 70.7 |
| South Korea | 66.5 |
| Israel | 65.8 |
| Oman | 38.5 |
| Issue Performance | |
|---|---|
| Iran | 48 |
| Kazakhstan | 44.7 |
| Moldova | 44.4 |
| Kyrgyzstan | 39.8 |
| Iraq | 39.5 |
| Oman | 38.5 |
| China | 37.3 |
| Viet Nam | 33.4 |
| Comoros | 32.1 |
| Gambia | 27.9 |
| Regulatory Quality | |
|---|---|
| Greece | 69.1 |
| Colombia | 52.9 |
| Armenia | 52.3 |
| Albania | 49 |
| Saint Vincent and the Grenadines | 48.4 |
| Jamaica | 48.2 |
| Panama | 47.3 |
| Montenegro | 46.3 |
| Saint Lucia | 43.1 |
| Oman | 38.5 |
| Voice & Accountability | |
|---|---|
| United Arab Emirates | 55.6 |
| Russia | 50.5 |
| Gabon | 45.8 |
| Thailand | 45.4 |
| Algeria | 44.8 |
| Iraq | 39.5 |
| Nicaragua | 39.2 |
| Oman | 38.5 |
| Cameroon | 33.6 |
| Afghanistan | 25.5 |
| Political Stability | |
|---|---|
| Germany | 77.2 |
| Estonia | 65.3 |
| Seychelles | 58.2 |
| United Arab Emirates | 55.6 |
| Antigua and Barbuda | 48.5 |
| Cuba | 48.4 |
| Namibia | 40.2 |
| Oman | 38.5 |
| Qatar | 37.1 |
| Fiji | 34.4 |
| Greater Middle East | |
|---|---|
| Tunisia | 46.7 |
| Lebanon | 45.4 |
| Algeria | 44.8 |
| Saudi Arabia | 44 |
| Egypt | 43.3 |
| Morocco | 42.3 |
| Iraq | 39.5 |
| Oman | 38.5 |
| Qatar | 37.1 |
| Sudan | 34.8 |
| Arab League | |
|---|---|
| Lebanon | 45.4 |
| Algeria | 44.8 |
| Saudi Arabia | 44 |
| Egypt | 43.3 |
| Morocco | 42.3 |
| Iraq | 39.5 |
| Oman | 38.5 |
| Qatar | 37.1 |
| Sudan | 34.8 |
| Comoros | 32.1 |
| Ease of Doing Business Index | |
|---|---|
| Luxembourg | 82.3 |
| Brunei Darussalam | 54.8 |
| Colombia | 52.9 |
| Costa Rica | 52.5 |
| Ukraine | 49.5 |
| Jamaica | 48.2 |
| Peru | 44 |
| Oman | 38.5 |
| Indonesia | 37.8 |
| Viet Nam | 33.4 |
JSON File:
EPI Report Year:
2020
EPI ISO3:
OMN
