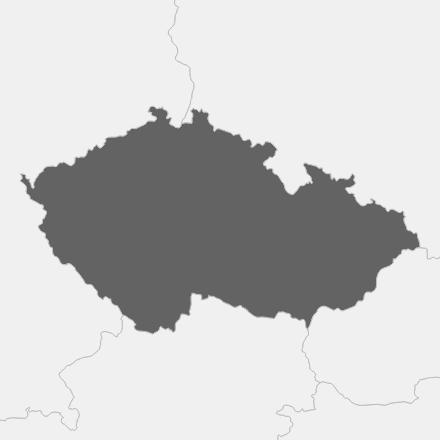
Czech Republic
RegionEastern Europe
GDP355.28[PPP 2011$ billions]
GDP per capita33435.51[$]
Population10.63[millions]
Urbanization74.06[%]
Land Area78592.43[sq. km]
Country Scorecard
Peer Comparisons
EPI Scores for this country and peers based on similar characteristics
| EPI Performance | |
|---|---|
| Ireland | 72.8 |
| Iceland | 72.3 |
| Slovenia | 72 |
| New Zealand | 71.3 |
| Czech Republic | 71 |
| Canada | 71 |
| Italy | 71 |
| Malta | 70.7 |
| United States of America | 69.3 |
| Greece | 69.1 |
| GDP per capita | |
|---|---|
| Spain | 74.3 |
| Slovenia | 72 |
| New Zealand | 71.3 |
| Czech Republic | 71 |
| Italy | 71 |
| Slovakia | 68.3 |
| South Korea | 66.5 |
| Israel | 65.8 |
| Estonia | 65.3 |
| Lithuania | 62.9 |
| Issue Performance | |
|---|---|
| Belgium | 73.3 |
| Slovenia | 72 |
| Czech Republic | 71 |
| Italy | 71 |
| Slovakia | 68.3 |
| Hungary | 63.7 |
| Croatia | 63.1 |
| Lithuania | 62.9 |
| Latvia | 61.6 |
| Poland | 60.9 |
| Regulatory Quality | |
|---|---|
| France | 80 |
| Japan | 75.1 |
| Belgium | 73.3 |
| Czech Republic | 71 |
| Malta | 70.7 |
| Israel | 65.8 |
| Latvia | 61.6 |
| Taiwan | 57.2 |
| Chile | 55.3 |
| Georgia | 41.3 |
| Voice & Accountability | |
|---|---|
| Japan | 75.1 |
| Slovenia | 72 |
| Czech Republic | 71 |
| Greece | 69.1 |
| Slovakia | 68.3 |
| Lithuania | 62.9 |
| Taiwan | 57.2 |
| Saint Vincent and the Grenadines | 48.4 |
| Saint Lucia | 43.1 |
| Cabo Verde | 32.8 |
| Political Stability | |
|---|---|
| Japan | 75.1 |
| Australia | 74.9 |
| Ireland | 72.8 |
| Czech Republic | 71 |
| Canada | 71 |
| Uruguay | 49.1 |
| Saint Lucia | 43.1 |
| Grenada | 43.1 |
| Botswana | 40.4 |
| Kiribati | 37.7 |
| Eastern Europe | |
|---|---|
| Slovenia | 72 |
| Czech Republic | 71 |
| Greece | 69.1 |
| Slovakia | 68.3 |
| Estonia | 65.3 |
| Cyprus | 64.8 |
| Romania | 64.7 |
| Hungary | 63.7 |
| Croatia | 63.1 |
| Lithuania | 62.9 |
| OECD | |
|---|---|
| Belgium | 73.3 |
| Ireland | 72.8 |
| Iceland | 72.3 |
| Slovenia | 72 |
| New Zealand | 71.3 |
| Czech Republic | 71 |
| Canada | 71 |
| Italy | 71 |
| United States of America | 69.3 |
| Greece | 69.1 |
| Ease of Doing Business Index | |
|---|---|
| Switzerland | 81.5 |
| France | 80 |
| Netherlands | 75.3 |
| Slovenia | 72 |
| Czech Republic | 71 |
| Slovakia | 68.3 |
| Portugal | 67 |
| Poland | 60.9 |
| Turkey | 42.6 |
| Rwanda | 33.8 |
JSON File:
EPI Report Year:
2020
EPI ISO3:
CZE
