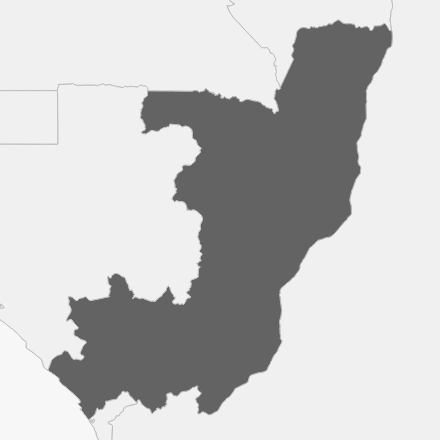
Republic of Congo
RegionSub-Saharan Africa
GDP26.35[PPP 2011$ billions]
GDP per capita5024.08[$]
Population5.24[millions]
Urbanization67.83[%]
Land Area343953.02[sq. km]
Country Scorecard
Peer Comparisons
EPI Scores for this country and peers based on similar characteristics
| EPI Performance | |
|---|---|
| Guatemala | 31.8 |
| Tanzania | 31.1 |
| Nigeria | 31 |
| Republic of Congo | 30.8 |
| Marshall Islands | 30.8 |
| Niger | 30.8 |
| Senegal | 30.7 |
| Eritrea | 30.4 |
| Benin | 30 |
| Angola | 29.7 |
| GDP per capita | |
|---|---|
| Tonga | 45.1 |
| Nicaragua | 39.2 |
| Honduras | 37.8 |
| Sao Tome and Principe | 37.6 |
| Samoa | 37.3 |
| Pakistan | 33.1 |
| Nigeria | 31 |
| Republic of Congo | 30.8 |
| Angola | 29.7 |
| Djibouti | 28.1 |
| Issue Performance | |
|---|---|
| Dem. Rep. Congo | 36.4 |
| Kenya | 34.7 |
| Zambia | 34.7 |
| Ethiopia | 34.4 |
| Republic of Congo | 30.8 |
| Benin | 30 |
| Angola | 29.7 |
| Ghana | 27.6 |
| Guinea | 26.4 |
| Cote d'Ivoire | 25.8 |
| Regulatory Quality | |
|---|---|
| Cuba | 48.4 |
| Iran | 48 |
| Algeria | 44.8 |
| Iraq | 39.5 |
| Equatorial Guinea | 38.1 |
| Central African Republic | 36.9 |
| Dem. Rep. Congo | 36.4 |
| Republic of Congo | 30.8 |
| Guinea-Bissau | 29.1 |
| Haiti | 27 |
| Voice & Accountability | |
|---|---|
| United Arab Emirates | 55.6 |
| Kazakhstan | 44.7 |
| Qatar | 37.1 |
| Zimbabwe | 37 |
| Central African Republic | 36.9 |
| Ethiopia | 34.4 |
| Rwanda | 33.8 |
| Cambodia | 33.6 |
| Cameroon | 33.6 |
| Republic of Congo | 30.8 |
| Political Stability | |
|---|---|
| Jordan | 53.4 |
| Armenia | 52.3 |
| Brazil | 51.2 |
| Russia | 50.5 |
| Bosnia and Herzegovina | 45.4 |
| Saudi Arabia | 44 |
| Georgia | 41.3 |
| Indonesia | 37.8 |
| Republic of Congo | 30.8 |
| Madagascar | 26.5 |
| Sub-Saharan Africa | |
|---|---|
| Comoros | 32.1 |
| Tanzania | 31.1 |
| Nigeria | 31 |
| Republic of Congo | 30.8 |
| Niger | 30.8 |
| Senegal | 30.7 |
| Eritrea | 30.4 |
| Benin | 30 |
| Angola | 29.7 |
| Togo | 29.5 |
| OPEC | |
|---|---|
| Venezuela | 50.3 |
| Iran | 48 |
| Gabon | 45.8 |
| Algeria | 44.8 |
| Saudi Arabia | 44 |
| Iraq | 39.5 |
| Equatorial Guinea | 38.1 |
| Nigeria | 31 |
| Republic of Congo | 30.8 |
| Angola | 29.7 |
| Ease of Doing Business Index | |
|---|---|
| Equatorial Guinea | 38.1 |
| Central African Republic | 36.9 |
| Dem. Rep. Congo | 36.4 |
| Timor-Leste | 35.3 |
| Republic of Congo | 30.8 |
| Angola | 29.7 |
| Guinea-Bissau | 29.1 |
| Bangladesh | 29 |
| Haiti | 27 |
| Chad | 26.7 |
JSON File:
EPI Report Year:
2020
EPI ISO3:
COG
